Visualisation with Altair (WS - UI Setup)
Visualising Data using Altair and creating a full stack application (Web service UI setup)
Visualisation of data has become important component for the business to make important decisions. More so in the data savvy world, as lots of data gets collected with internet tracking metrics and when internet of things come to picture, the amount of data that is collected is immense.
However, understanding what we can do with the data is more important. This is generally done by a separate field of work as data analytics. But for the data analysts to inform the meaningful insights a slide deck or a web page is needed so that the data analyst can easily share the information.
It is equally important for data scientists to provide meaningful insights on the predictions made by the model explaining why the model predicts what it predicts. Business teams typically dont do anything because “The computer says so..” keeping a company’s future at stack. Explaining the model and its prediction with a good visualisation is a well taught out way to express the prediction result data to easily make sense for business users.
Concerns and tools
To build the charts there are lots of tools that come handy. PowerBI, Tableau, Dash are some of the examples. However, they have some concerns:
- They are commercial and typically costs thousands of dollars to use
- They don’t provide live data and the underlying data can be updated in batches only.
Other tools such as Voila and Stream-lit are free and open source and interactive but typically takes a couple of minutes to load when deployed in cloud.
Since these tools are separate we have to go with a different strategy when we use charts such as coming up with a PowerBI , Voila, Streamlit specific server that runs separately.
Other straight forward tools such as D3.js Vega-lite needs UI expertise and consumes more time than the above solutions and is little out of reach for a typical data scientist or data analyst.
What if… We have a tool that works in the same UI , Web service technology and can generate charts within 4 lines of code and provides interactivity. This search gave made us reach Altair.
Altair
Altair is a open-source python library that is used to generate charts. “Whats special about Altair ?” you may ask. Yes, there a a bunch of python libraries that could generate charts. Matplotlib, Plotly, Seaborn are some of them that come to my mind.
What makes Altair different from them is that we can generate json from the Altair library in vega-lite specification. “Ok.. So what ?” if you ask.. You can use vega-lite in UI to render this json into a meaningful graph in a webpage that gets rendered.
Advantages
If you ask “Why is it so important”, well.. We can:
- Create a web-service API for charts using Altair. Charting solution doesn’t need to be considered as a separate solution that you have to deal with differently
- Since python has connectors to almost all datasources, looking for connectors might not be an issue
- If the charts are to be used by larger audience, load balancing solutions on web-services is well dealt with. Hence talent pool to address the issues is available
-
If the complete chart data is not from a single table or datasource, we can build the logic to deal with it.
Say we have couple of metrics from SQL, few more from Postgres and another one is a model prediction. We could customise the logic to pull the data from relevant datasources and append the model prediction and display the chart even before saving the solution.
- Provide interactivity within the charts with opens to customise the graphs
- Integration with authentication solutions such as OAuth for free
I know there are ticks for some of the tools that I have mentioned. But Altair ticks the complete checklist.
Existing Solutions that use similar setup
When I tested how reliable is altair, I had to check if there was tools built with these stack. Obviously, there are few products that use part or mentioned the complete setup being used.
-
Kibana
Popular for the ELK stack for visualisation, Kibana uses Vega specification to build the graph. They allow to write Vega specifications to create customised dashboards.
-
Chartio
Chartio which is joining Atlassian by March 1, 2022 has written a nice blog on why they moved away from D3 to the Altair+Vega for the Nitro product here.
This is enough proof of the idea that we are going in a right direction. So, we started building a Proof of Concept to see how the whole thing pens out.
Architecture
For the simplicity of understanding lets create a simple architecture diagram as we are trying to create a sample demo application to see if this can work out.
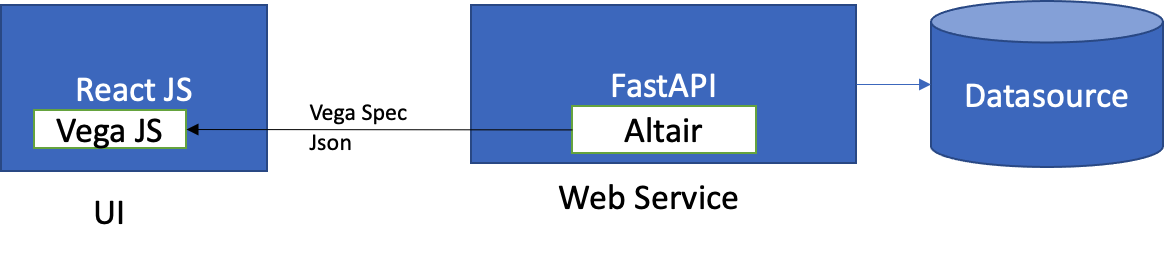
Components
- Datasource
The data is in datasource. For the code that you are going to see, it might be a CSV but you might be easily able to connect to any datasource, as it is simple python code only.
- Web Service
The web service is written in FastAPI for the demo. It has advantages over Flask. But the solution can work with Flask as well. The idea is to create a web-service with Altair that could connect to the data and generate JSON in vega lite specification using Altair
- UI
UI can be built using any technology (such as React here). Our idea is to use Vega JS to understand the json response from the web-service and generate the chart. This reduces the UI requirement knowledge for development as most of the designing such as chart creation, color selection and placement of charts are done in the web-service layer itself.
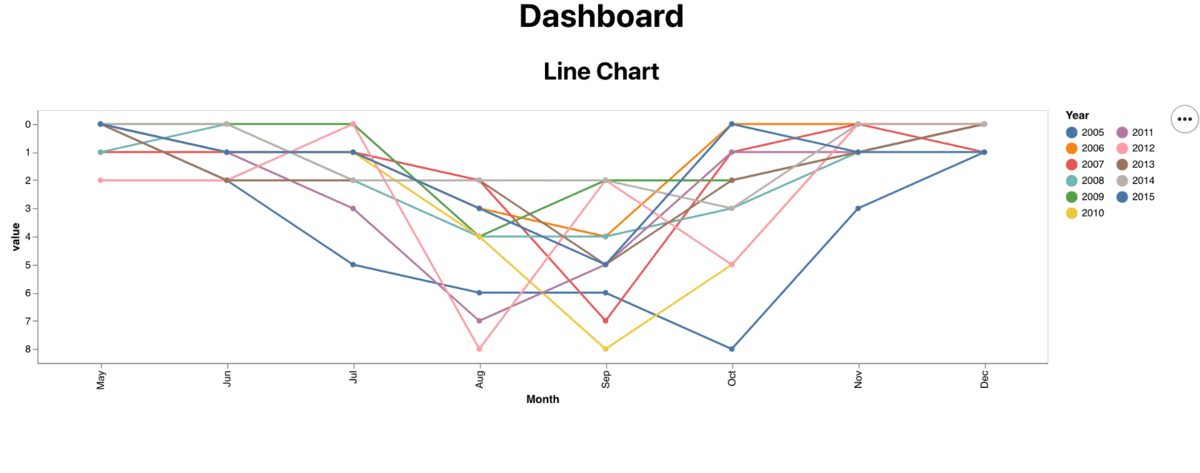
Lets look at the completed product before we look into the code
Webservice
We used FastAPI ****python package here. But our solution is not dependent on that. If you are using Flask, it would work as well.
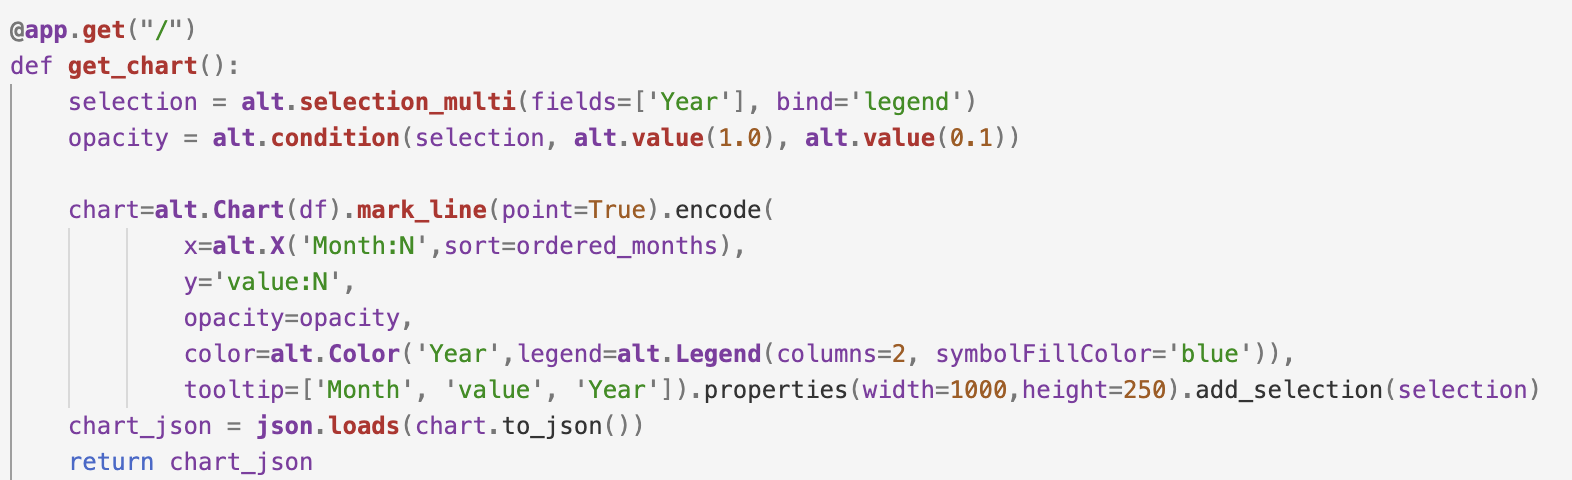
The entirety of the code that creates the chart with selectable legends is below
First install the required libraries including altair
Steps in the function:
- We first create a selection that will work on legends and filter the Year field.
- We set a condition to change the opacity of the lines based on the selection that we make
- Create a altair chart with the pandas dataframe with X-Axis as Month and Y-Axis as value. We can also set other options like opacity, color, tooltip, height and width of the graph
- Convert the chart to json
- Return the converted JSON
UI
UI is built on react for the demo.
We include vega related libraries in package.json
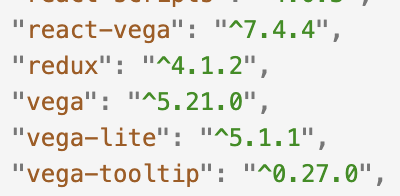
This is the screenshot of what we have added in our project.
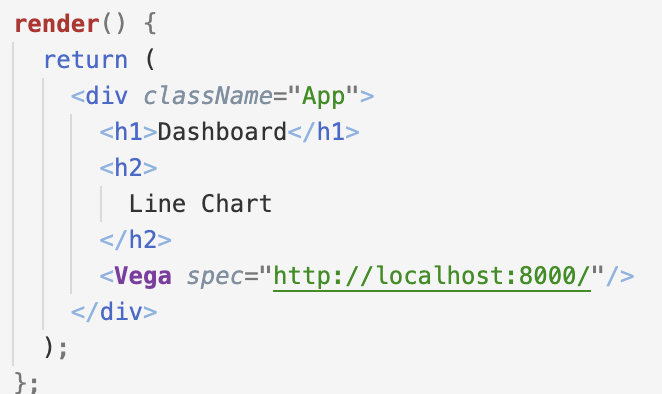
Once we have added the desired packages, in the component which you want the graph to be rendered use the Vega tag and in spec specify the URL of the web-service which gives the json response in vega-specification such as the above.
Now, we can run the Web-service and UI together.
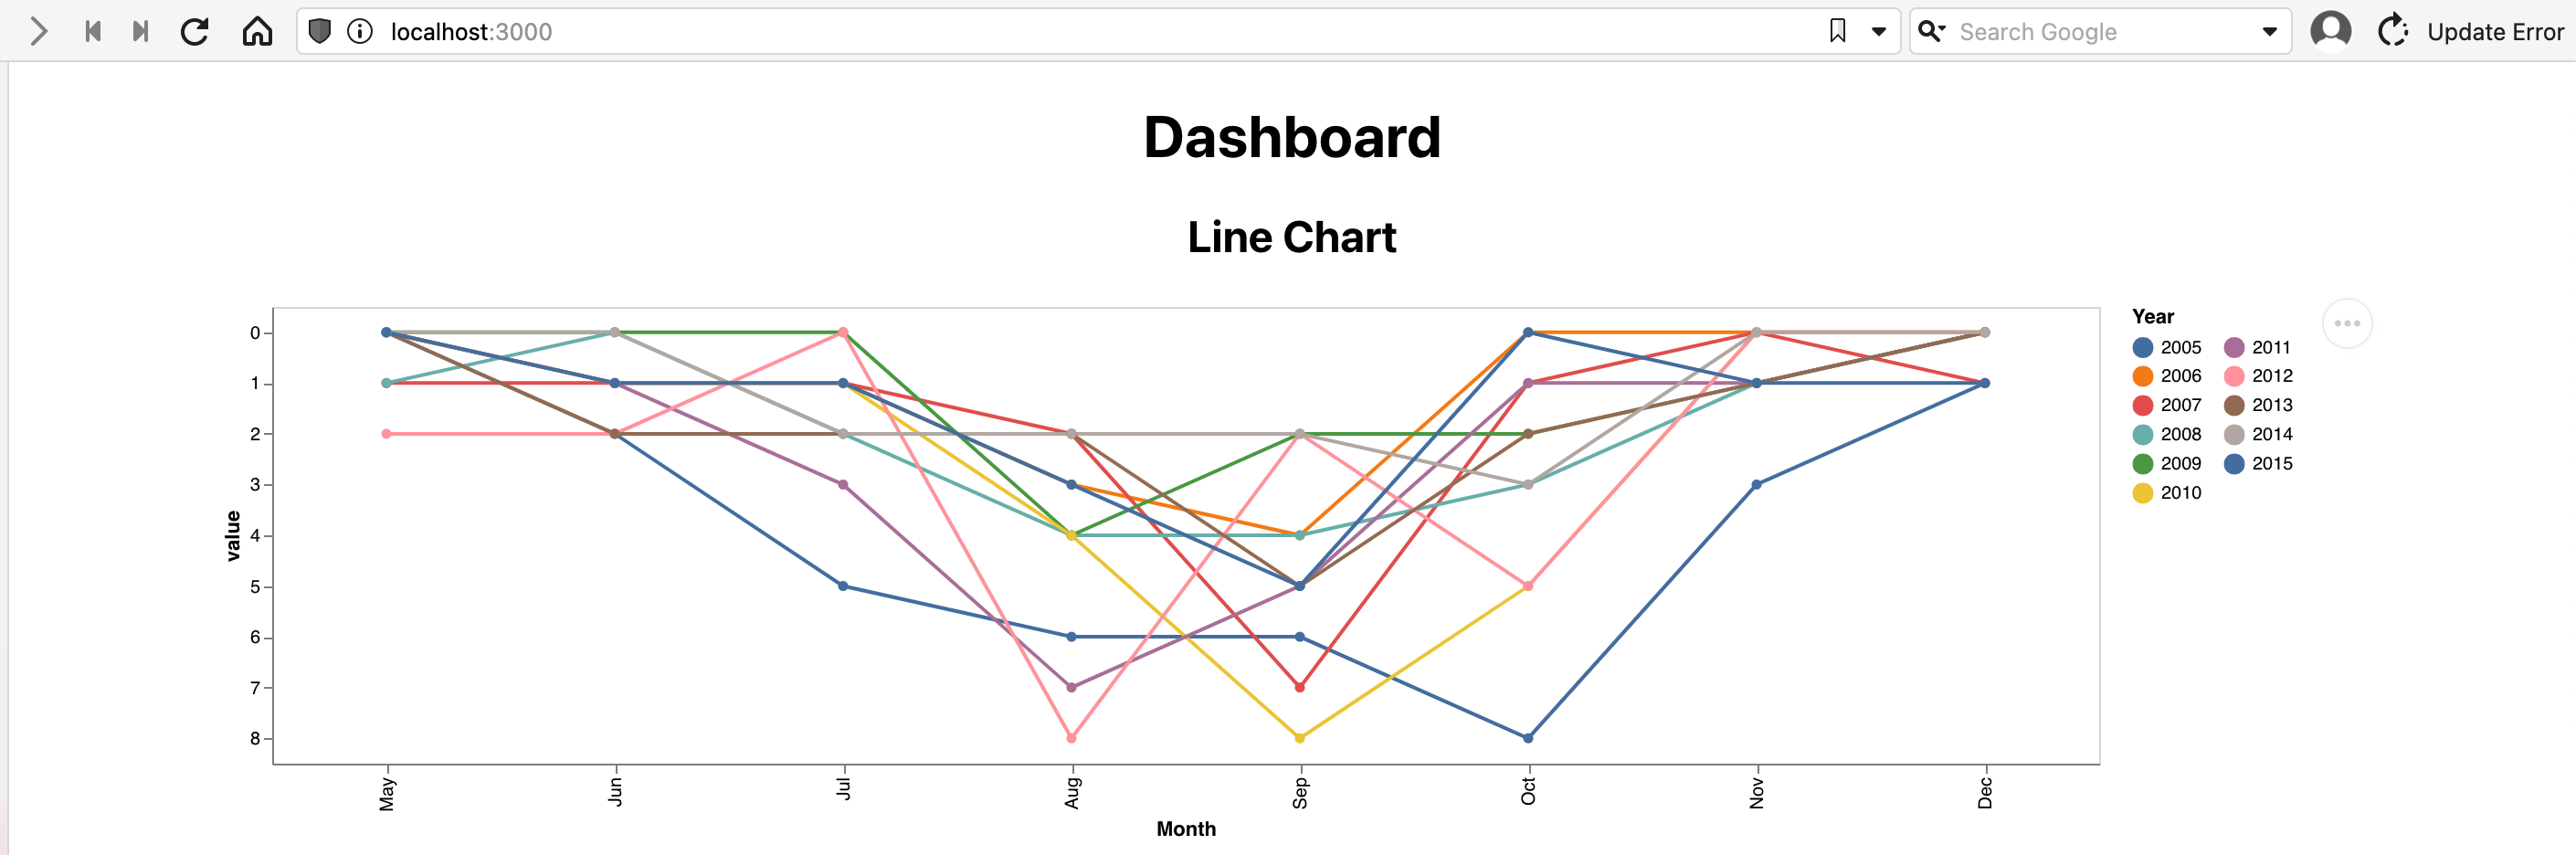
Vola!!!
The application is up and running.
For data scientist or non UI python developers, its easy to create charts in Web-service with complete control on the rendering graph such as even the height and width of the graph to be rendered.
The UI code and Web Service code for your reference is available